Revamped Course Analytics
We’ve rebuilt Course Progress Analytics to give you a faster, more reliable way to understand how learners engage with your courses. Let’s learn what has changed and how it will help you better understand your learners' progress!
⭐️How Do These Changes Affect You?
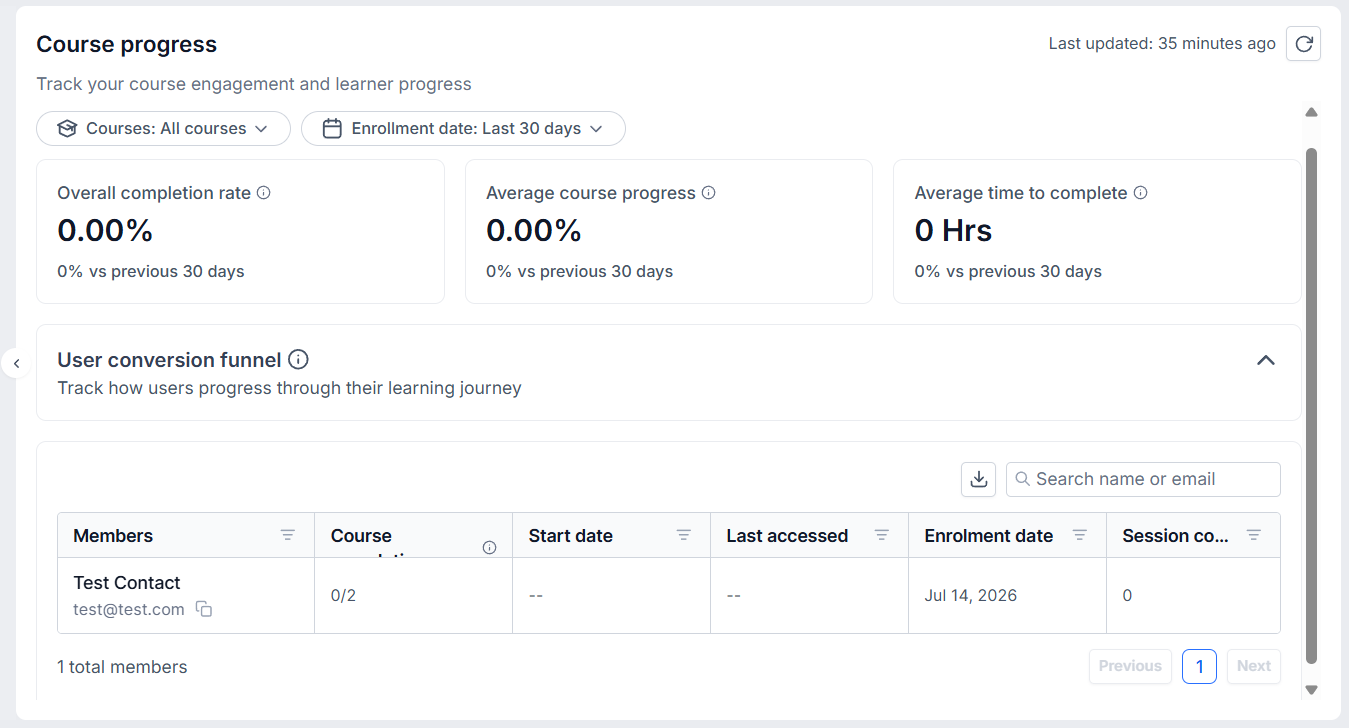
Data Centralization: The Dashboard now shows a unified view of key metrics, such as Time to Complete, with period-over-period comparisons and filters for Course and Enrollment Date.
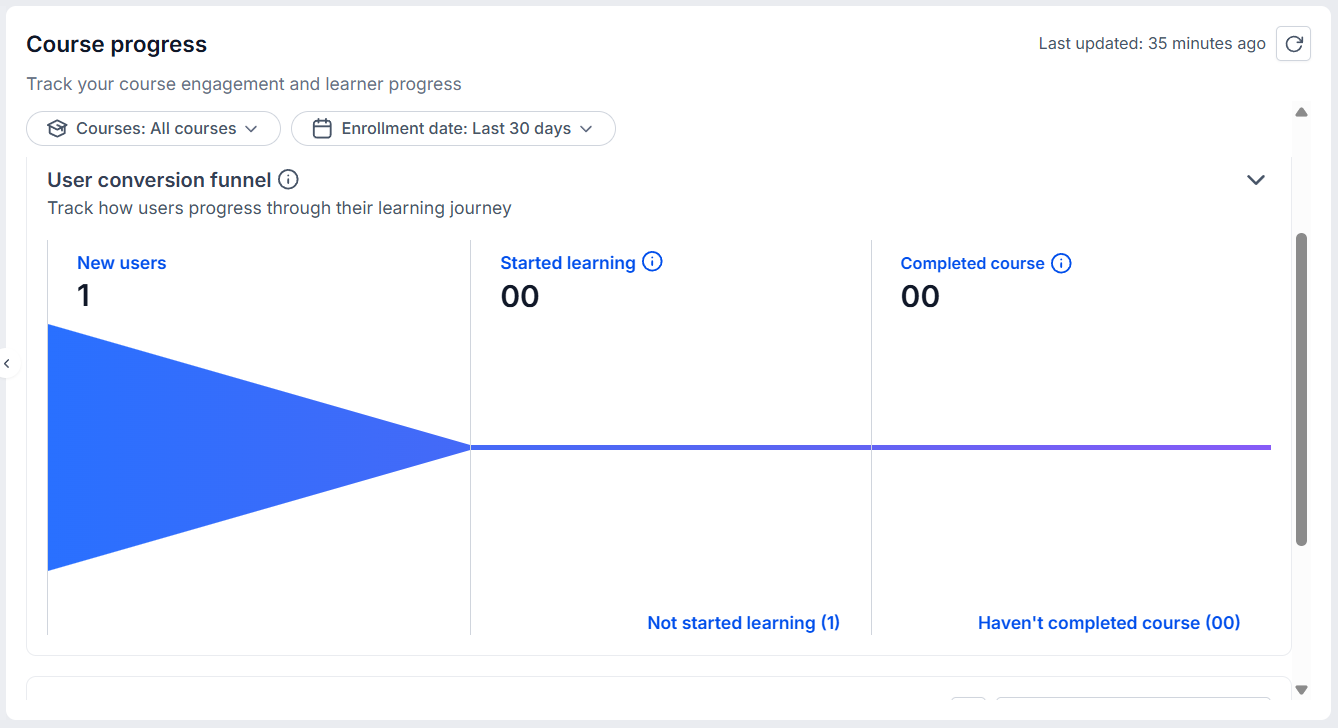
User Conversion Funnel: We’ve added a Learner Journey Funnel showing learners' advancements from enrollment to completion for a more efficient overview.
Member-Focused Views: The member progress table is now more detailed with enrollment, activity, completion, and session details.
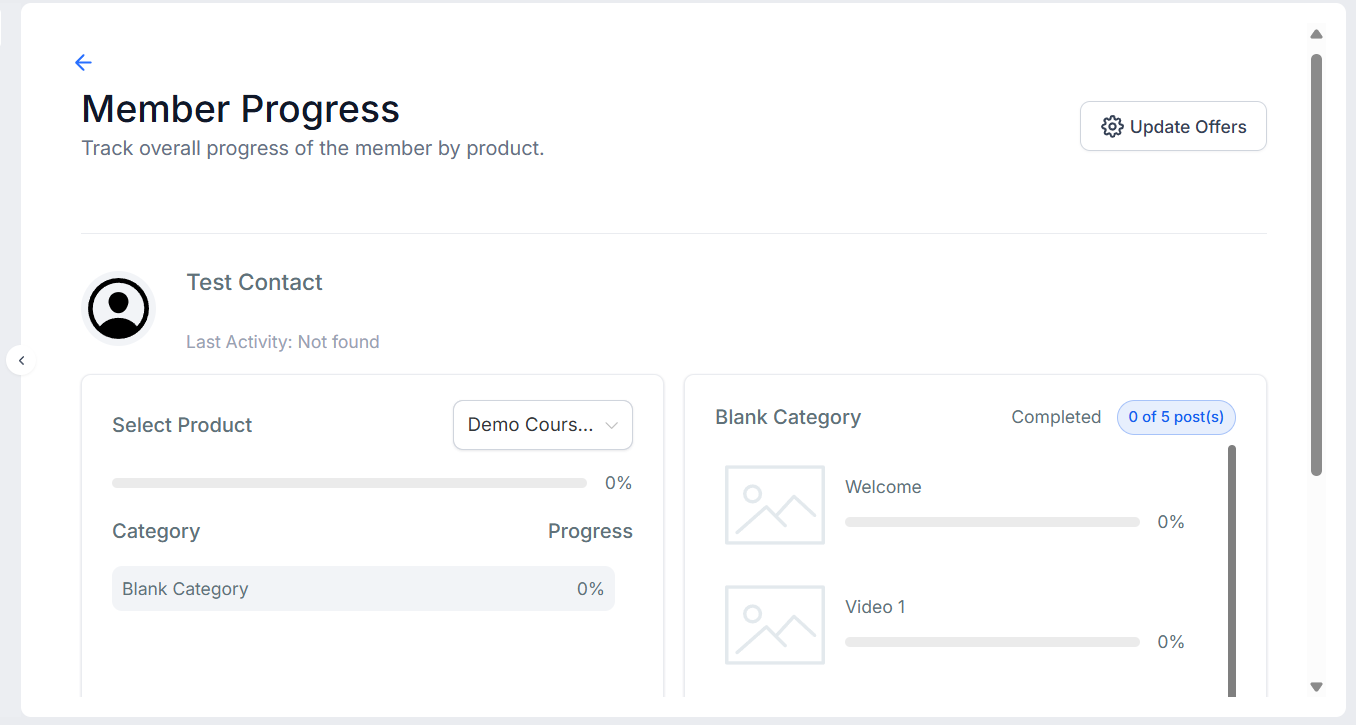
⭐️How To Access A Member’s View?
Let’s go over how to view the detailed data for an individual member!
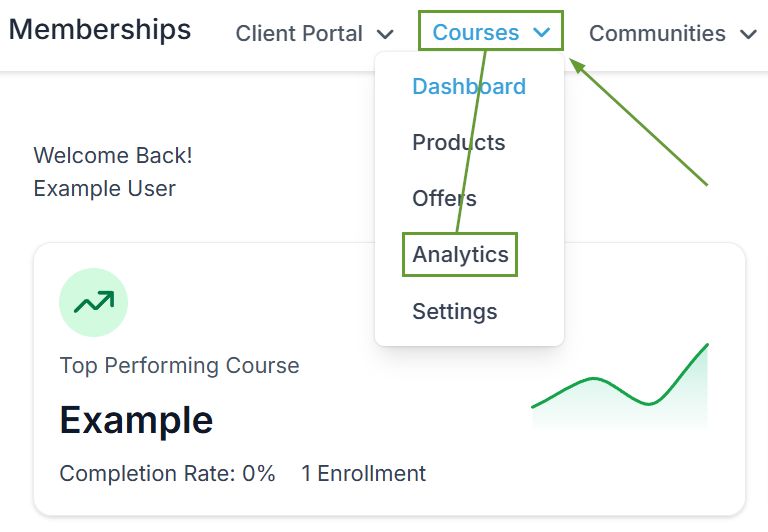
Head to the Analytics area inside the Courses tab of your Memberships section.
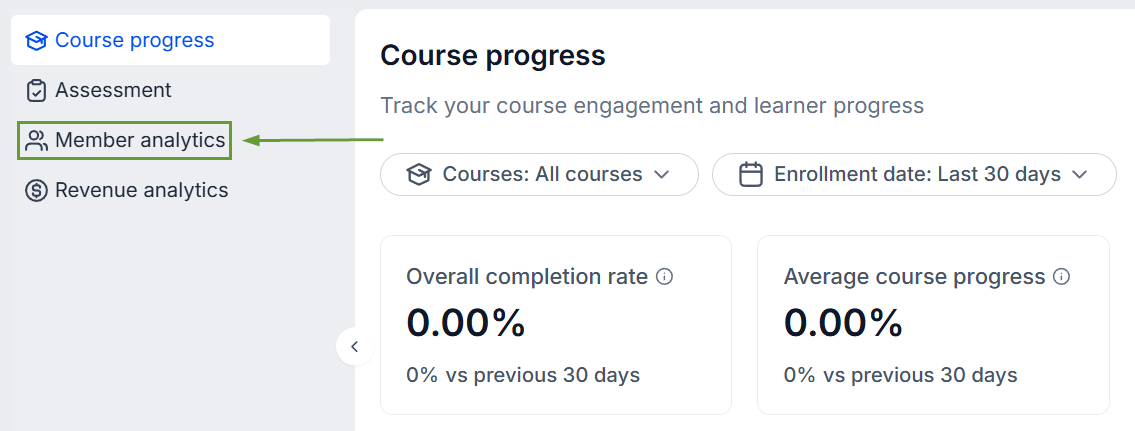
Switch to the Member Analytics tab.
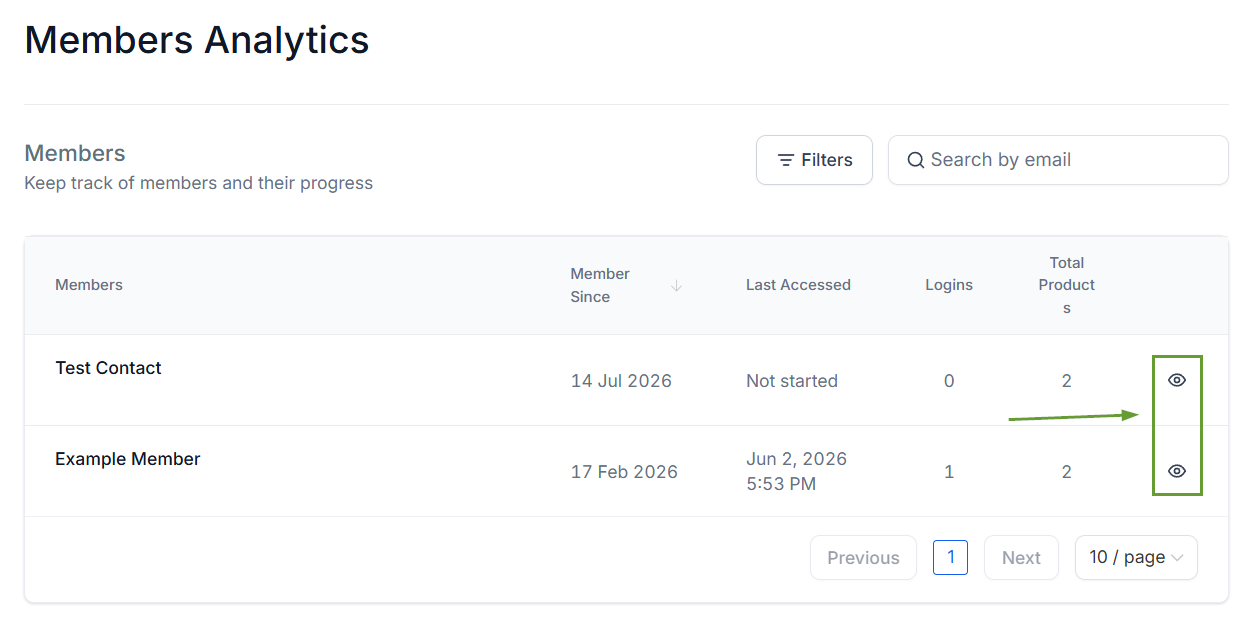
Click the eye icon next to the contact you want to view.
Use the dropdown menu to select the specific product you want to view insights for.
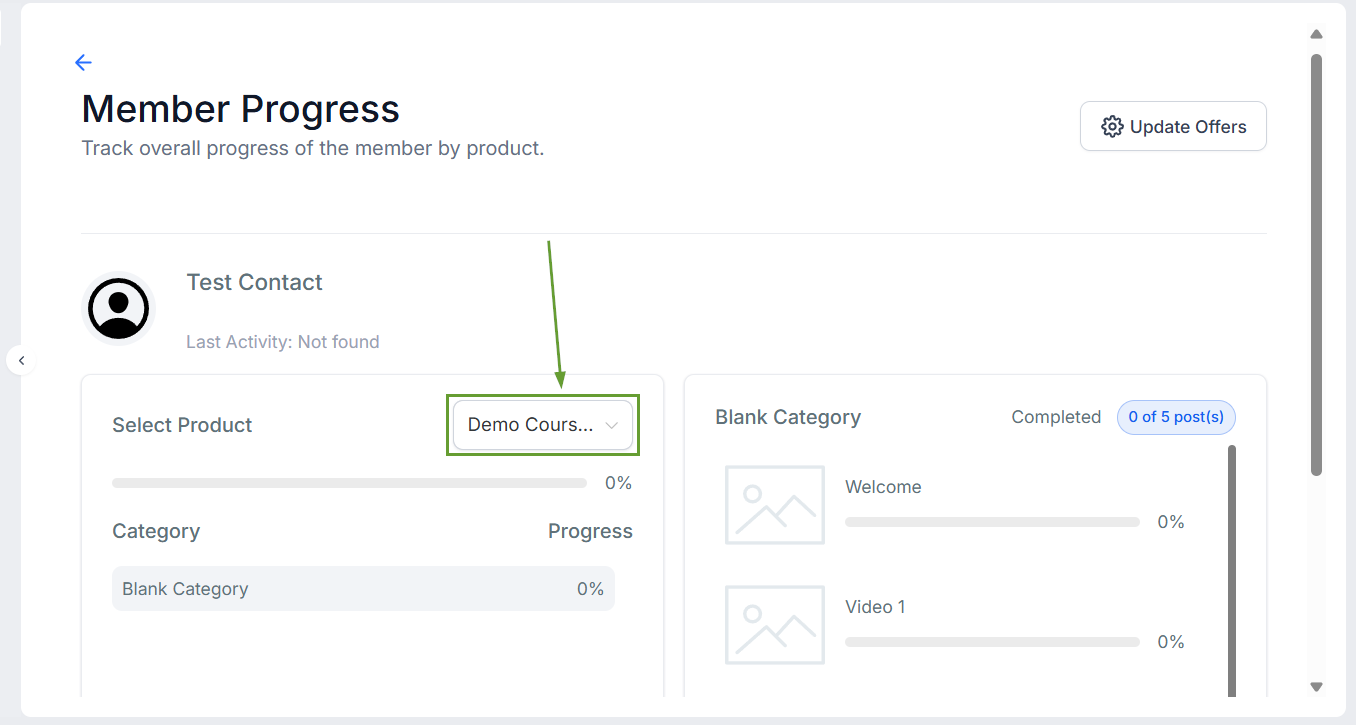
Now, you can track completion trends, identify drop-offs, and drill into individual learner progress from a single dashboard, making it easier than ever to understand your learners' experience and improve your content based on tangible data. We hope you enjoy it!
